Log in    RU  


Main page :: Forum :: Technical - Ultrasound scaners, DICOM soft etc. ::

3D vector analysis of 2D echograms


Tags: Hi-tech

   Posts
 
  3D vector analysis of 2D echograms
#1

    The 21st Conference of Open Innovations Association FRUCT

    Helsinki, Finland

    6-10 November 2017

    3-Dimensional Vector Analysis of 2-Dimensional Ultrasound Diagnostic Images, by Yuriy Kolesnichenko, Uzgraph, Olga Kolesnichenko, Security Analysis Bulletin, Gennady Smorodin, Dell EMC External Research and Academic Alliances, Russia

    external link

:: attachments(2) ::

:: file 1 ::

:: file 2 ::

  07:26 16-08-2018
  3D Vector analysis of digital image...
#2

    3D Vector analysis of digital images for computer vision

    Y.Kolesnichenko, MD, Sonologist, www.uzgraph.ru.

    Keywords: computer vision, computer aided detection.

    Abstract

    This article presents the continuation of work with the vector analysis algorithm. In this paper, in contrast to the previous one, there is an analysis of images not only of diagnostic ultrasound but also from the satellite Google map(planes and ships).

    Also in this article discuss a new option of the algorithm - color censoring.

    Which significantly increases the probability of finding a target on the map, including on a map with several similar targets.

    The new algorithm showed a scale-independent property without using the image scaling option.


    This article presents the continuation of work with the vector analysis algorithm. This paper previously was published in russian in my russian website - http://www.uzgraph.ru/izbranno...

    In this article is discussed the second version of my vector analysis algorithm which I called Barracuda. Please, don't ask me why.

    If in first paper discussed only medical ultrasound images then in this analysis was included not only a diagnostic ultrasound images but also images from the satellite Google map(planes and ships). It's because someone could think that my algorithm can work only with ultrasound images. No, it is absolutely universal.

    3 series of images was included in this study: satellite Google map planes, satellite Google map ships and ultrasound images of small hemangiomas: 2 in the kidney and one in the liver.

    Besides, images of the kidney hemangiomas were made on a different ultrasound machines - Esaote MyLab 70 and Medison SonoAce R7 but on the same type of probe - linear with convex mode and liver hemangioma was made on Medison SonoAce R7 with convex probe. Which did not affect the result of the algorithm.

    The algorithm code was significantly optimized in comparison with the previous version, in particular with regard to the amount of caching of intermediate data to the hard disk, and the stack algorithm was also significantly reworked from static to dynamic algorithm with orientation to the amount of RAM allocated to the algorithm. New version of the algorithm now partially works on 2 cores of the CPU based on the Fork & Join principle, which certainly accelerates the work at the initial stage of the algorithm, when the need for a single process in the amount of RAM is minimal, but in subsequent stages this loses its meaning, because as a priority the stack algorithm still needs a large amount of RAM, and the division of RAM into parts with Fork & Join negates the benefit of using several CPU cores, we can just not start to talk about the increasing of the number of read and write operations to the hard disk at the same time. Parallel computing is not effective in this context.

    Also new options were added to the new algorithm, in particular, the ability to censor the target image by colors, which allowed to separate the search object from the background on the target image, i.e. to cut off the "noise" from the "useful signal" .


    A


    B


    C


    D

    Fig. 1. An example of the effectiveness of color censoring on a series of images with aircraft.

    A - without censorship (Target), B, C, D - with censorship (Filtered Target).

    Fig. 1A clearly shows that without censoring the colors, the target image is on 90% consisting of background so the algorithm finds background. This is a known problem, which is solved in different ways, in particular, as a rule, with the help of variants of the Sobel operator.

    At fig. 1B, 1C and 1D can be seen (in a smaller image) that not all of the target image is highlighted in red, but only the " useful signal" or the search object itself, which is only 10% of the target image (without background) and so algorithm finds the object.

    Also it should be highlighted that the images shown in fig. 1 are really different, i.e. this is not an artificially rotation of the same image (such series were used in the previous work) of the same aircraft, but different images of different planes of the same class made at different angles.


    A


    B

    Fig. 2 An example of the effectiveness of color censoring on a series of ultrasound medical imaging - as an object of search (target or template) is an image of a hemangioma of the liver obtained on a Medison SonoAce R7 convex probe and as an area for the search for an object, the image of the kidney hemangioma obtained on the linear probe in convex mode of Esaote MyLab 70.

    A - without censorship (Target), B - with censorship (Filtered Target).


    A


    B

    Fig. 3 An example of the effectiveness of color censoring on a series of medical imaging ultrasound - as an object of search (target or template) here is the image of the kidney hemangioma obtained on the linear probe of Medison SonoAce R7 in the convex mode, and as an area for the search of the object is the image of another kidney hemangioma obtained on the linear probe of Esaote MyLab 70 in same mode.

    A - without censorship (Target), B - with censorship (Filtered Target).

    Figures 2B and 3B show a reduction in the number and size of "noise" region of interest (ROI), due to the removal of the background from the search map, which was in fig. 2 up to 50%, and in fig. 3 up to 18% of the target image. The smaller difference between the images in Fig. 3 because the target in figure 3 was a rectangular shape, which made it possible to obtain a good object / background ratio without color censoring.

    The same effect can be observed on a series of images with warships.


    A


    B


    C


    D


    E


    F

    Fig.4 An example of the effectiveness of censoring colors on a series of images with warships. These images of different ships, ie, the pattern of one ship is found on the image with another ship: B and C are of a similar class (size), D and E are of another class (smaller size), F - vice versa (i.e. the ship-template is smaller than the detected ship).

    A - without censorship (Target), B, C, D, E and F - with censorship (Filtered Target).

    To the annotation to fig. 4 D, E and F, it is necessary to add that in spite of the fact that the algorithm originally included the option of scaling of the template (target image) to fit it under the object in the map image, but in connection with the technical limitations (computation power limit) of the available equipment, this option was not involved neither in the first work, nor in the present! Ie even without scaling the template, this algorithm is able to recognize similar objects of a different size, both larger and smaller. Ie this algorithm shows the property of scale independence. The same trend can be seen in fig. 3, where the object on the template (hemangioma) is clearly larger than the object (another hemangioma) on the "map" .

    In addition, an assessment of the possibility of searching for a particular object (target, aircraft, warship) on a map with several similar objects was made.


    A


    B

    Fig. 5. An example of detection of a target object (template) on a map with several similar objects.

    A - a series of warships, the target is locked; B - a series of aircraft, the target is locked.

:: attachments(16) ::

:: file 1 ::

:: file 2 ::

:: file 3 ::

:: file 4 ::

:: file 5 ::

:: file 6 ::

:: file 7 ::

:: file 8 ::

:: file 9 ::

:: file 10 ::

:: file 11 ::

:: file 12 ::

:: file 13 ::

:: file 14 ::

:: file 15 ::

:: file 16 ::

  22:42 13-09-2018
  Classifier of images
#3

    Classifier of images based on 3D vector analysis

    In this short publication, I continue to inform about the work on my computer vision algorithm.

    Finally, my hands reached the classifier.

    The same target images (templates) and the same threshold as in previous works were used.

    To test the performance, to classifier was given the task for classifying, or by another words for selecting into groups / species all target images, i.e. everything was placed into one place: airplanes, ships and hemangiomas.

    And this is what happened, see the attached file.

    At the very top you can see the sequence of target images from left to right according to the principle of their complication from the point of view of vector analysis, i.e. from simple to complex or as I would say - from amoeba to man.

    Near you can see the groups that the classifier made by split this sequence.

    In comparison with presented works about of artificial neural networks, some probably paid attention, there are no names of groups like: aircraft, hemangiomas, ships. This algorithm does not set itself such a task, but such dictionary can be added in this algorithm.

    As I mentioned in previous works, one of the most promising directions for CAD in my opinion is a development of work with image libraries, with the possibility of add a new image to a group already available or even defining their subgroups, i.e. a multi-level classification, i.e. not only 1,2,3, but also 1a, 1b, 1c, etc.

    And this algorithm demonstrates this possibility on groups with hemangiomas.

    As you can see, everything was easier with planes and ships, but with hemangiomas instead of one group it turned out as much as 3.

    And, if you look closely at these groups, you will see that in all three groups there is a common term, a hemangioma somewhat resembling a rose flower. I.e. it has a signs of the other two hemangiomas, whereas the other two hemangiomas do not have common signs, but are linked into a common group due to a common "relative" and also the algorithm suggests two more groups of two members each. I.e. this is something like a family tree, i.e. a parent and his children.

    In my opinion, this is a very promising result for practicing physicians - to be able to automatically classify different lesions, for example, the lesions or thyroid gland by analogy with Bi-rads and Ti-rads.

    And I want to draw the reader's attention once again to the fact that this algorithm is not an artificial neural network, it's just a statistical algorithm based on the vector analysis presented earlier.

:: attachments(1) ::

:: file 1 ::

    results-of...thm.pdf (46 Kb)

  19:38 21-10-2018
 
#4

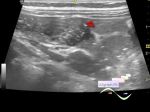
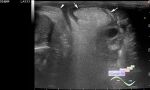
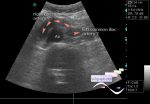
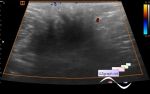
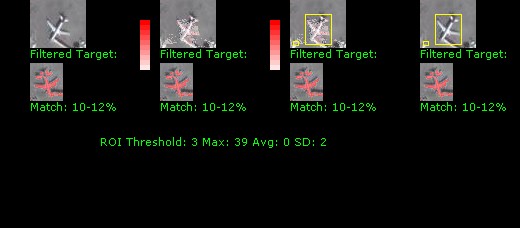
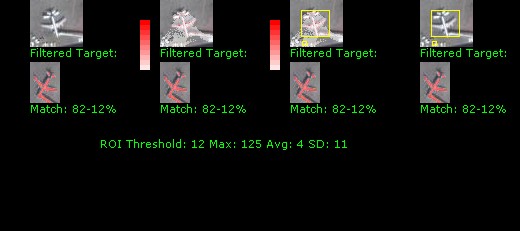
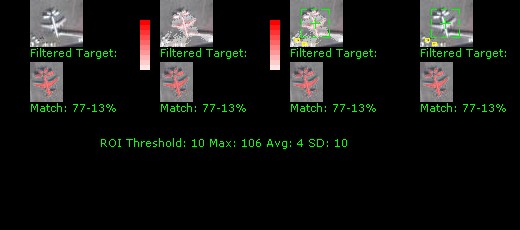
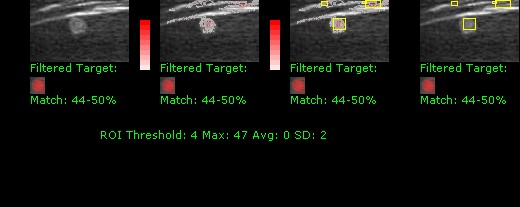
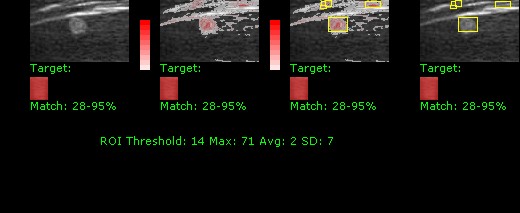
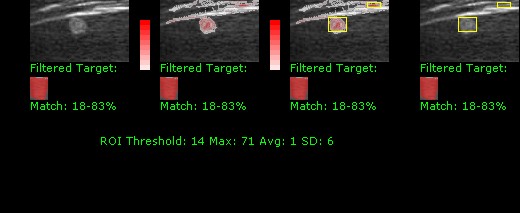
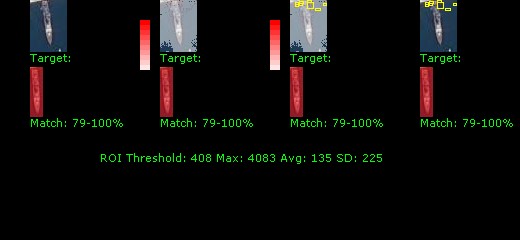
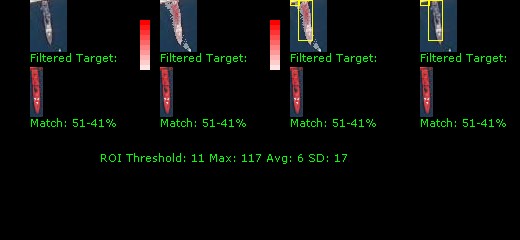
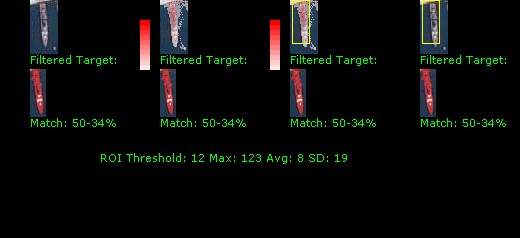
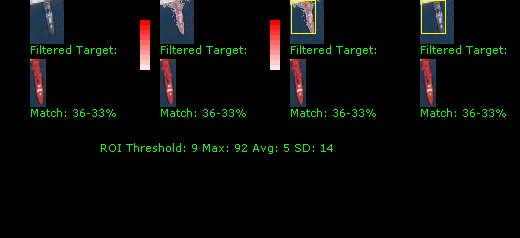
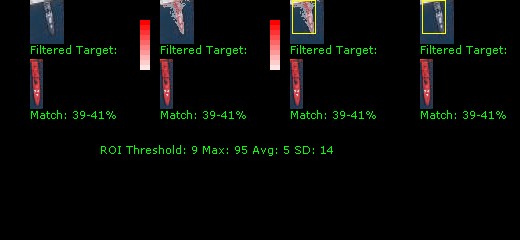
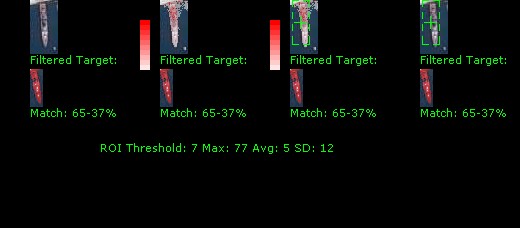
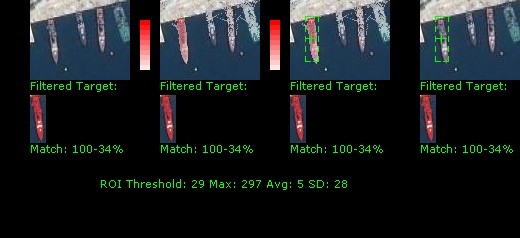
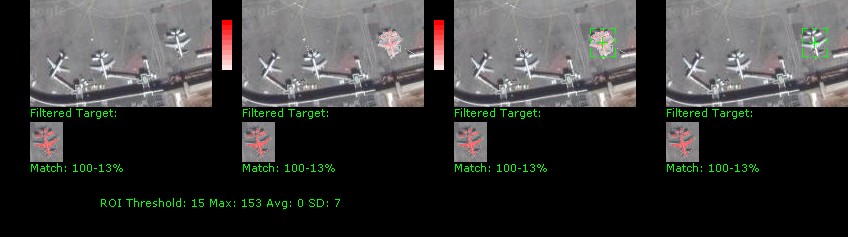
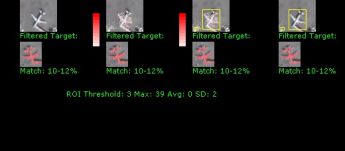
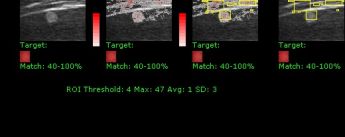
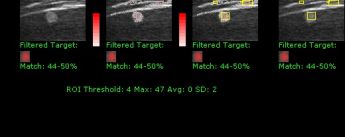
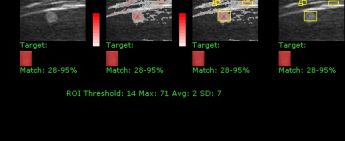
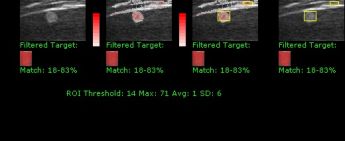
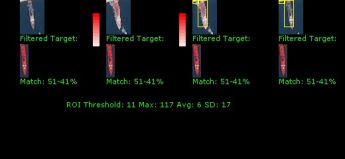
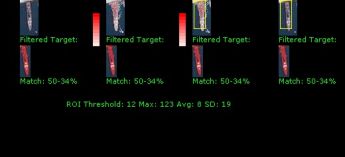
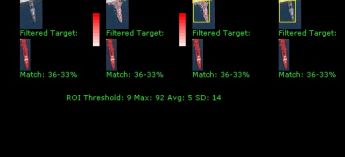
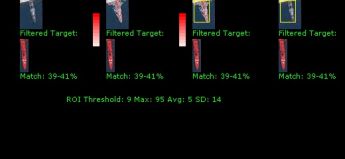
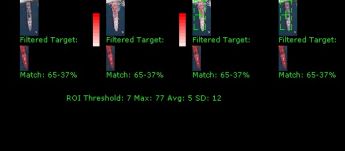
    Classifier based on 3D vector analysis (continued) and search engine.

    This work is a continuation of all my previous work on this topic.

    In it, I continue to analyze the possibilities of classifying of complex images, such as ultrasound images in particular.

    In some way, all the objects in this world are similar.

    We can ask different people about the similarity of the same objects and hear the different opinions.

    When we talk about the computer, this does not make any sense to ask it a similar question at all, because a people uses some kind of irrational extrapolation of data. But computer is not.

    This is due to the complexity of the human brain, which can be roughly divided into the conscious and subconscious, and if complicated, there can be several consciousnesses, this can be quite clearly observed in children up to 4-5 years old, when they can easily switch from one mood to another for a split second - a second ago, baby was crying, and after a second he or she was already smiling. For an adult, mentally healthy person, this is problematic, since he has a dominant consciousness, the rest are suppressed.

    The subconscious is an extremely mysterious and unexplored part of our mind.

    It can be compared with the controlling authority, which constantly with you, monitors you and sometimes through some of your emotions gives you solutions, without arguments, appeals, sources of these data, any pro and contra - i.e. imperatively.

    The computer doesn't have it; I’m not talking about the pitiful attempts to simulate these processes called artificial intelligence or artificial neural networks.

    Yes, to a computer can also be given certain parameters for extrapolation, but the computer does not suffer with irrationality. Therefore, the specified parameters of the degree of similarity will always be known to the computer.

    Therefore, it is not necessary to ask the computer whether these or other objects are similar, ask as far as (%) these or other objects can be considered similar!

    Ultrasound images of cases of verified mammary gland lesions were selected for this publication from the site external link

    From two categories: benign lesions: external link

    and malignant: external link

    The files have been renamed, including the name includes their GET variables from the URL on the site - i.e. all the names of the files of benign images began with "295_" , and the malignant ones with "304_" .

    Further, these images were cropped to eliminate unnecessary objects (background), such as a black background on the sides and even just large areas of normal breast tissue around the lesions, as far as it was possible because of the shape of these lesions.

    Several images were excluded from the dataset, since they contained additional graphical information, such as arrows and measurement markers.

    In this paper, to the type of classification already announced in a previous publication -

    1 - according to the percentage of matched vectors in the compared images;

    I added another type:

    2 - by the percentage of the largest found region of interest (ROI) to the target image (or in other words, the template image).

    To determine the range of coincidence of images from this dataset, a step of 5% was chosen.

    According to the first type of classification in this dataset, can be find groups of similar images only within 15%.

    According to the second type of classification - up to 70%

    It is clear that the higher threshold percentage corresponds to the smaller group.

    And as the threshold decreases, the groups become larger, but less selective, i.e. both benign and malignant tumors get into them. So the upper thresholds can be considered more specific, and the lower more sensitive.

    The most interesting thing is that in the layout of the second type of classifier with a dataset of 24 images and with a threshold of 70%, I got the same tendency of the "tree" , which was in the previous version of the classifier, i.e. in 1 type with hemangiomas - 3 groups, one of 3 images, and 2 of 2 images. All three groups have 1 common image - "parent" - which links the remaining two either into 2 groups of 2 or into one group of 3. All three images are visually similar and all belong to the same category "304" , i.e. malignant (see attached file 1).

    Certainly, as the threshold is lowered, as it has already been described, specificity decreases, and sensitivity increases, which means that benign and malignant images can be found in one group - because all of them have the background of normal breast tissue, which unites them all.

    Further, on the basis of existing solutions, it was not difficult to implement what I mentioned in the very first publication.

    I.e. about the prototype of the search engine, like Google.Images, but to search for medical images on the base of the sample image.

    Imagine such a situation, experienced doctors hardly need it, of course, that the beginning ultrasound doctor finds some kind of lesion, for example, in the mammary gland, and does not know how to properly describe it, doubts.

    Of course, you can just go to the wonderful site ultrasoundcases.info, where there is a directory with cases and to see all of them, if you have time for this? I think this is the most correct decision!

    But suppose you do not have this time and want to get a quick answer to the eternal question - what is it?

    And here just such a search engine can come to the aid of a young doctor (see the attached file 2).

    It' s very simple as you can see! Just uploaded the image and got similar with the percentage (probability) of matching your findings to those already in the database!

    Moreover, such a database is easy to update - just add pictures with the necessary code marks in the file name to database directory on the hard disk drive!

    Very simple, but not quite! Because, as I wrote in previous articles, to use this algorithm in the full power, you need a very powerful computer with a large amount of RAM (terabytes) and a large hard disk capacity (petabytes or more), and moreover, a very fast hard disk drive such as M.2 or faster. Otherwise, technically, everything is simple!

    There remains one more, the most important component, not directly related to the operation of the algorithm, but having the most direct relation to its results - the database!

    I.e. the algorithm cannot work correctly without a database, namely, a set of morphologically verified images!

    I am grateful to the doctor Taco Geertsma for permission to use images from ultrasoundcases.info

:: attachments(2) ::

:: file 1 ::

    results-of...sis.pdf (58 Kb)

:: file 2 ::

    results-of...sis.pdf (190 Kb)

  21:27 28-10-2018
 
#5

    New video

    external link

:: attachments(1) ::

:: file 1 ::

  22:56 07-11-2018
 
#6

    First publication:

    external link


 Random 
Ultrasound cases - Necrotizing Enterocolitis
    

Ultrasound cases - Traumatic epididymitis
    

Ultrasound cases - Anomaly of caudal aorta
    

Ultrasound cases - Lymphostasis?
    

Ultrasound cases - Willis circle at ultrasound
    

 Dictionary 
PD

DPD

LVPWd

GS

PA

Freeze

Aliasing doppler artifact

RVOT

TV

CFM


 Calculators 
Thyroid volume

Teicholz systolic cardiac function

Gestational age by Ultrasound

TI-RADS

Pressure gradient


 Similar topics 
Technical - Online sonograms measurement